Pages

Live blogging Feed

Wednesday, June 27, 2012

Report: iOS Users Driven to Update by Features Rather than Security

Report: iOS Users Driven to Update by Features Rather than Security:
Apple’s latest update of its mobile operating system, iOS 5.1.1, provides several bug fixes and security improvements to its users. The update, released May 7, makes a number of small fixes affecting the reliability and usability of the devices, and, more significantly, patches security holes which allowed for malicious attacks on the user’s Web experience. Chitika Insights observed adoption rates during the first week of release in a previous report, and now looks at updated data to examine adoption rates three weeks post-release.
To quantify this study, Chitika Insights took a sample composed of hundreds of millions of ad impressions from within the Chitika Ad network; ranging from May 25 to May 31, 2012. A user agent analysis was then conducted on this sample of data to determine the current rate of adoption for iOS 5.1.1 compared to other iOS versions available in the market. A table depicting the results of this study can be seen below:

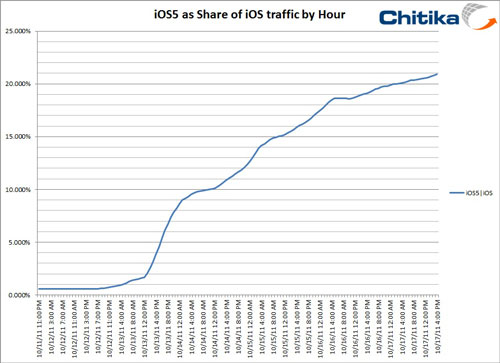
Our data shows that a significant majority of iOS users – 57.9% – have updated to version 5.1.1, and 83.3%  are operating on some version of iOS 5 (which is not available for the iPhone 3G and earlier, or 1st and 2nd generation iPod Touch). Of those who are on iOS 5, 69.6% of users have the latest software release. The three-week overall adoption rate of 57.9% represents an exponential increase in rate of adoption when compared to the 12.3% adoption in the first week. But notably, this is dwarfed by the adoption rate of iOS 5 in October of last year, which was installed on 20% of iOS devices in its first week. Despite the fact that iOS 5.1.1 fixed a major security issue, users were much more eager to install the feature-heavy package of iOS 5.
Based on these statistics, it is evident that users of Apple mobile devices are, as a group, much quicker to upgrade their software when a new release touts new features, rather than security fixes, despite their importance. However, it does seem that auto-update options and automated reminders on these devices are highly effective for those who wish to be as up-to-date as possible.

Study: Firefox Update Strategy Pays Dividends

Study: Firefox Update Strategy Pays Dividends:
On the heels of last month’s report regarding the impressive adoption rate of Firefox 12, Mozilla’s 13th iteration of its flagship browser hit the Web on June 3, a day before its official release, due to an online leak. With its past success in migrating users to new versions, the Chitika Insights team wanted to see if the adoption of the newest Firefox version would fare similarly.
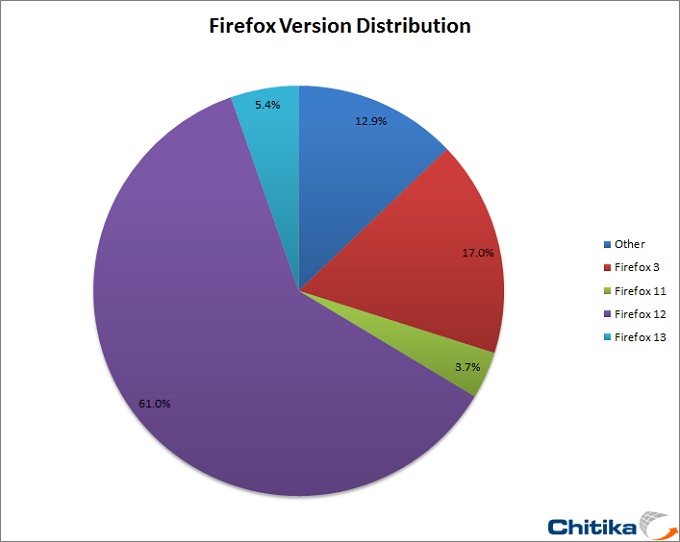
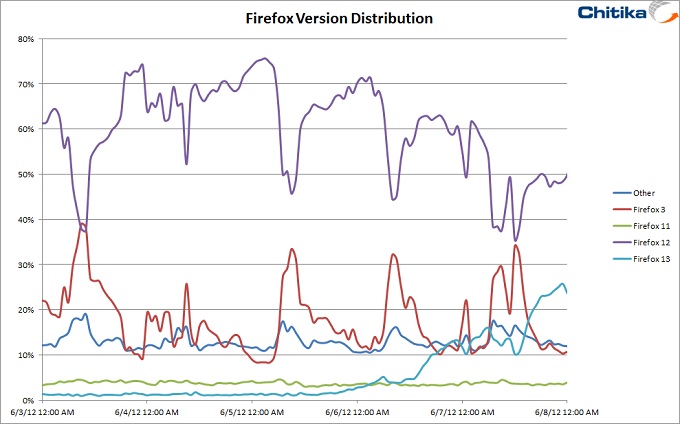
Somewhat impressively, four days following the leak and only three days since the official launch, the browser commanded more than 5% of Firefox’s online market share. But better evidence of Mozilla’s user updating prowess was elsewhere – Firefox 11 usage, which constituted 38% of Firefox online activity on May 7, has shrunk to just fewer than 4%, with nearly all of those users making the switch to Firefox 12 without automatic prompting.
Some other unique findings:
  • Firefox 3 users are very committed to that version of the software, with their usage share only going down 1% since May 7, making it the second-most popular version of the software one month later.
  • The Firefox 12 usage statistics re-emphasize the recent success of Firefox’s auto-update feature, and points to an upcoming high degree of adoption for Firefox 13.
  • The difference in user behavior between Firefox 12 and Firefox 3 is significant. Looking at market share on an hour-by-hour basis, Firefox 3 users browse much more during daytime hours, while Firefox 12 users are much more active during the evening. This brings up the possibility that later versions of Firefox attract users as the browser of choice at home, but not at work.
Stay tuned to Chitika Insights as we track the progress of Web browsers as new versions of Internet Explorer, Chrome, and others are introduced over the year.

Study: Windows 8 Release Preview Slow to Gain Traction

Study: Windows 8 Release Preview Slow to Gain Traction:
For years, Microsoft has been a major force in the personal computing market. However, as the tablet market continues to expand and become a dominant force in the computing world, Microsoft has been forced to adapt. The radical shift in operating system design and usage styles between PC’s and tablet’s presents a potential challenge for consumers, who are accustomed to the traditional Windows aesthetic and navigation.
A recent study by Chitika Insights showed a positive launch for the Consumer Preview of Windows 8 with the new OS making up to 0.13% of all Windows traffic two months after it became available. Microsoft recently launched the Windows 8 Release Preview for PCs, and the response does not seem to be as enthusiastic as it was for the earlier version as Web traffic share percentages seem to be falling.
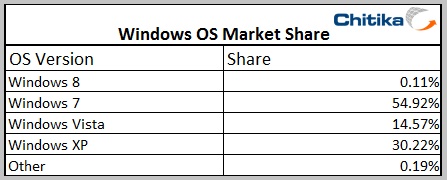
To quantify this study, Chitika Insights took a sample of hundreds of millions of impressions from the extensive Chitika ad network; ranging from May 31 to June 6, 2012. The sample was then aggregated based on operating system version, depicting the usage share of Windows 8 compared to the other versions of Windows through user agent analysis. These figures can be seen in the following table:
The data shows a usage share of 0.11% for Windows 8 Release preview. Compared to an earlier Chitika study, Windows 8 usage share has dropped down by 0.02% since April. One of the potential reasons for the previous response could be that some of the traffic we saw in our last study came from reviewers who were loaned Windows 8 tablets by Microsoft for the purpose of this review. Another reason could be that Windows 8’s metro interface looks good on the tablets but when it comes to laptop or desktop, the users could be left confused.
For publishers and advertisers, preparing in the face of the introduction of a new operating system or software platform is essential, although somewhat of a daunting task. Monitoring the traffic mix of a site to ensure every user is able to consume and interact with the property is central in maintaining key performance indicators. Advertisers’ running campaigns also face the same issues – ensuring that a campaign can effectively reach every section of a target market, regardless of software or operating system version will increase the effectiveness of messaging and campaign ROI.

The iOS App market sales run rate is $4 billion per year

The iOS App market sales run rate is $4 billion per year:
At the 2012 WWDC, Apple released new data concerning its App ecosystem. Namely:
  1. 30 billion apps downloaded to date (excluding updates)
  2. $5 billion paid to app developers
  3. 400 million iTunes accounts
These three data points allow us to update our picture of the app economy. First, the app download rate.
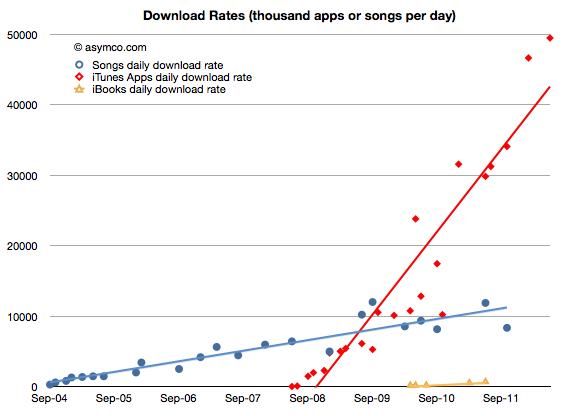
As would be expected from an expanding user base, the app download rate has been increasing. It is now at about 49.5 million apps downloaded every day. The history of this rate is shown in the chart below:

I added the same data for iTunes songs and book downloads for comparison. Note that although music and books are available to the same user base (actually higher due to Macs and iPods which do not run apps,) apps are being downloaded at a far faster rate–at least four times faster.
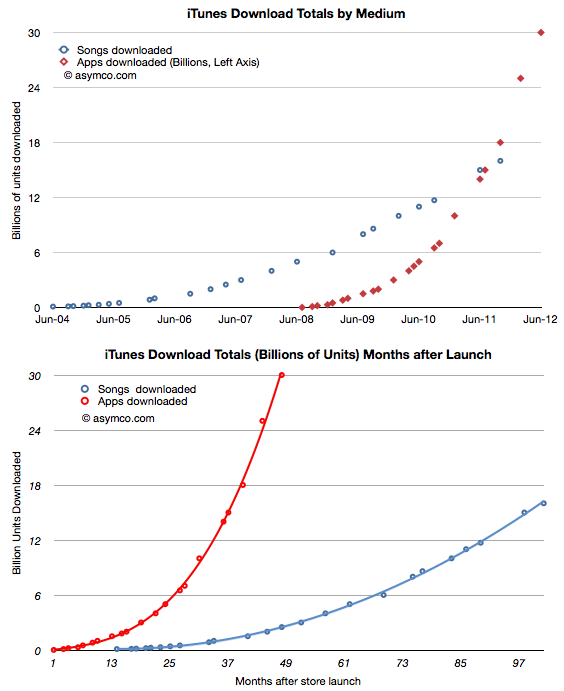
In terms of total, cumulative downloads, the comparison is even more stark:

It won’t be long before total app downloads will be double total song downloads. Put another way, in the time it took the App store to reach 30 billion, the song store sold only 3 billion.
On average, songs are more expensive than apps ($1.29 vs. $0.24). What is the difference in value, not just units?

The data shows that apps have very likely overtaken songs as “gross” income. Apple does not book all app income, only the 30% share they keep, but in terms of transaction value, clearly apps are now a bigger business.
What about consumption? Are individual iTunes account holders buying a constant or variable number of songs or apps?

Here again apps show a distinctive pattern of out-performing songs. As far as digital media is concerned, apps are taking the download business by storm.
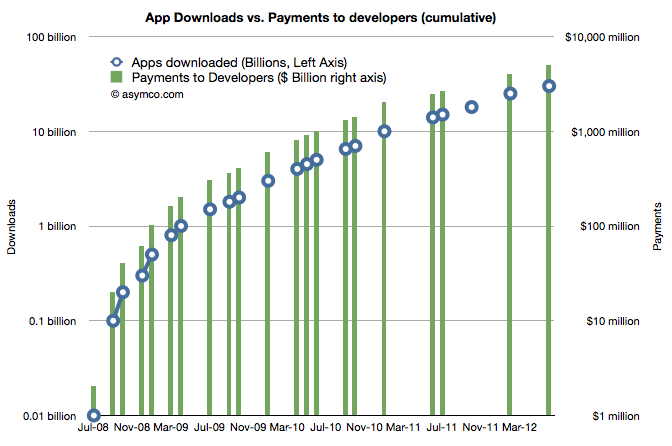
What about pricing? Is the expansion of the user base into the hundreds of millions leading to a collapse in app pricing?

No. You can see the price as the ratio between the downloads and the revenue to developers. If downloads scale more rapidly than payments then pricing is decreasing. As it turns out the average price of an app has held steady since approximately 1 billion downloads were recorded. That price is now about 24 cents per app (including free).
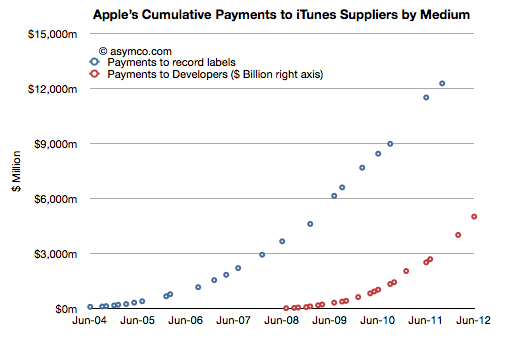
Finally, how about the content owners? Are payments to the owners of the media beginning to favor developers over music publishers/promoters?

Developers still have a long way to go. We can’t be sure about how revenues are shared with music labels, but it’s probable that they are still receiving bigger checks than developers. However, under some scenarios this will change quite soon.
The bigger story here is that the iOS app economy has reached a run rate of $4.3 billion per year from a standing start four years ago.
How big will the TV app economy be four years from the launch of an Apple smart TV?

[Infographic] The Clash of Ecosystems – The life and death of mobile platforms

[Infographic] The Clash of Ecosystems – The life and death of mobile platforms:
Presenting our new infographic – the Clash of Ecosystems. Android, iOS, Windows Phone, BlackBerry, bada and others are locked in a winner-takes-all battle – and everything revolves around an ecosystem. This infographic presents key figures for each of our competing platforms, smartphone penetration per region – but it also shows what happened to platforms that didn’t make it.
Which platform has the largest sales base? Which has the largest app store, with the most downloads? Check out the answers in the Clash of Ecosystems infographic – as well as the mural of dead (or dying) platforms, our Dead Platform Graveyard.
This infographic is based on the VisionMobile report “Clash of Ecosystems”, available for free download at www.visionmobile.com/Ecosystems
Feel free to copy the infographic and embed it in your website (embed codes below the infographic).
[Infographic] Clash of Ecosystems: The life and death of mobile platforms
150 pixels wide version
500 pixels wide version
800 pixels wide version

Share:
These icons link to social bookmarking sites where readers can share and discover new web pages.

  • email
  • Digg
  • LinkedIn
  • Reddit
  • DZone
  • Ask
  • Google Bookmarks
  • Live-MSN
  • MySpace
  • Squidoo
  • Technorati
  • Slashdot
  • YahooBuzz
  • YahooMyWeb
  • Blogosphere News

Mobile Usage Update: iOS Users Responsible for 72% of All Mobile Traffic

Mobile Usage Update: iOS Users Responsible for 72% of All Mobile Traffic:
It looks like June is shaping up to be a likely battleground for mobile dominance, with a number of significant developments coming out of the Apple and Android communities.
June 11, 2012 marked the 30th annual Apple Worldwide Developers Conference (WWDC), and with it a plethora of new products and features coming out of the tech titan. One of the more notable events of the conference was the unveiling of iOS 6 and at least 200 new accompanying features.
Since its debut in late 2011, Ice Cream Sandwich (Android 4.0, ICS) has begun to really hit its stride, making its way out to a growing number of phones and tablets. Manufacturers across the board are pumping out spec-leading devices with an increasing frequency. Samsung’s Galaxy S III is making its debut June 21, 2012 across all five major U.S. mobile carriers (as low as $199), and will be taking advantage of many of the greatest features of ICS, putting it in a position to step up toe-to-toe against the iPhone.
As the competition between iOS and Android continues to heat up, turn to the Chitika Insights Mobile Dominance Tracker, as the only available real-time source for mobile usage.
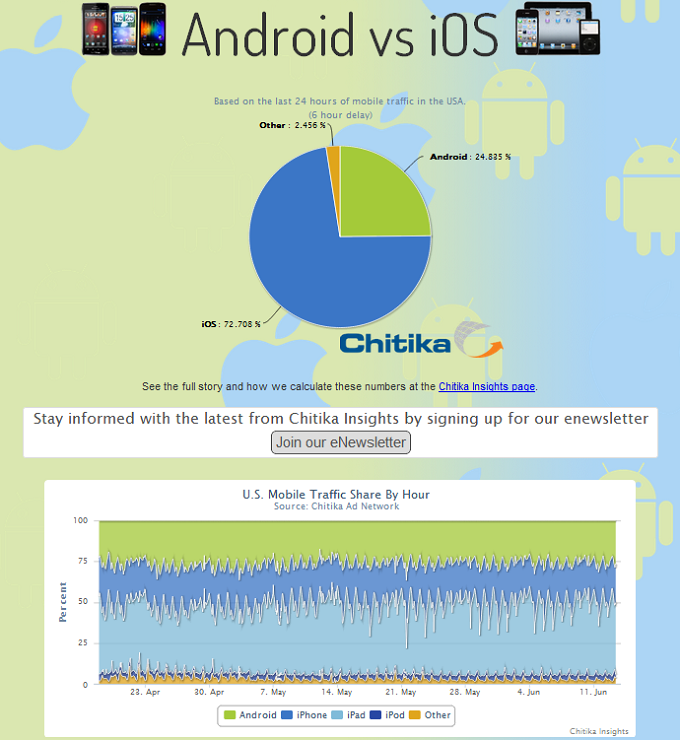
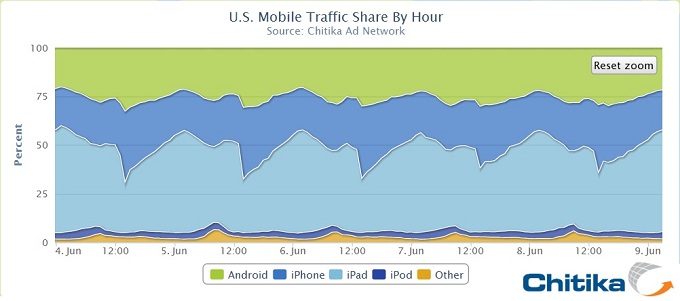
The current share of Android vs. iOS traffic depicts Apple’s mobile devices as the clear front-runners, generating almost three times (72%) the amount of traffic as their Android counterparts (26%). Apple’s iPad is responsible for putting up the lion’s share of web usage – approximately twice that of the iPhone, while the iPod makes up the meager remainder.
In terms of use on an hourly basis, iPad usage consistently trends sharply downwards during the afternoon hours only to rise again in the evening. This is the type of distinctive, behavioral trend that indicates tablet usage being overwhelmingly personal, rather than professional.
iOS 6 will undoubtedly make a splash this fall when it’s released to the iPad and a rumored iPhone5. However, it is important to note that despite boasting a list of impressive features, many of these updates and upgrades are already in place on ICS powered devices. This may not prove to be a problem for Apple, though, as the fragmentation of Android’s platform continues to remain an issue for the OS.
Continued fragmentation of Android can prevent many users from accessing some of the latest features and upgrades available from ICS. A prior Chitika Insights study shows that as of March, 2012 only 1.5% of all Android users were running the OS.  Apple, which traditionally has been quite good at ensuring as many people as possible are running the latest version of iOS could capitalize on this weakness moving forward, to potentially increase its market share.
Stay tuned to future Chitika Insights research reports on technology and the mobile space!

Barnes & Noble Nook Surpasses Kindle Fire in Tablet Traffic Share; Apple iPad Takes Small Dip

Barnes & Noble Nook Surpasses Kindle Fire in Tablet Traffic Share; Apple iPad Takes Small Dip:
Since its release in 2010, Apple’s iPad has made a name for itself as the standard in tablet computing. Competing manufacturers, though, have not given up on improving their shares of tablet web traffic. While manufacturers strive to become competitive with lighter devices, improved resolution, and other features, there is yet to emerge any serious competitor to the iPad. With more tablets entering the market every week, we wanted to update to our tablet study from early May with the latest data.
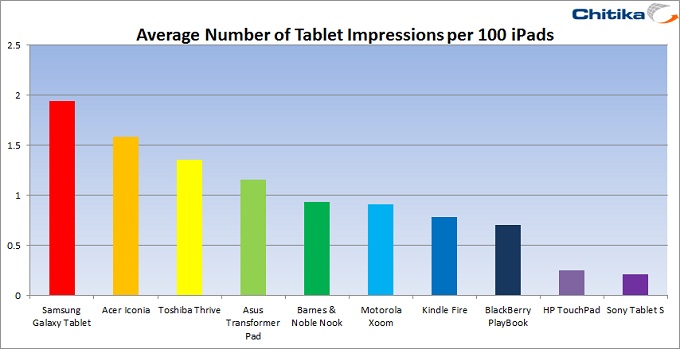
To quantify this study, Chitika Insights took a sample composed of hundreds of millions of impressions from the Chitika Ad network; ranging from June 4 to June 10, 2012. A user agent analysis was then conducted on this sample of data to determine the distribution of impressions across devices classified as tablets. The data was then relayed in accordance to the average number of devices per 100 iPads. A table depicting the results of this study can be seen below:

We found that 91.07% of tablet web traffic comes from iPad devices. While the iPad still accounts for a great majority of tablet web traffic, it has fallen about 3.5% from the 94.64% figure we reported in early May. The rise in use of non-iPad tablets is likely an effect of the increased options for consumers (hundreds of models are available), in addition to declining tablet prices. Among non-iPad tablets, the Samsung Galaxy leads the pack with 1.77% of tablet web traffic and 1.94 devices per 100 iPads. Other tablets performing particularly well include the Acer Iconia, Toshiba Thrive and Asus Transformer Pad.
Aside from iPad share, a significant finding from this study is that the Barnes & Noble Nook has overtaken the Kindle Fire in web traffic impressions. Compared to our previous study of tablets per 100 iPads, the Kindle has maintained its share while the Nook has gained. Barnes & Nobles’ e-reader with tablet capabilities now accounts for 0.85% of all tablet web traffic versus Kindle Fire’s .71%. In the time since that study, Barnes & Noble has launched a new advertising campaign, and their newest device sold out within weeks. While that device is a simple e-reader without web browsing capabilities, the increase in Nook use may be attributed to brand familiarity through these advertisements.
As future tablets are released onto the market, we may expect to see the iPad’s share drop to levels more comparable to its overall mobile device share. With Windows 8 tablets expected in the fourth quarter, the future of tablet web traffic will certainly be interesting to observe.
Without a doubt, the tablet market has become a real and significant source of web traffic, and developers must be sure their sites are formatted across all operating systems. Outside of web traffic, applications running on tablets present a huge opportunity for advertisers to reach their desired market.

Update on Android growth

Update on Android growth:
In February of this year MediaTek introduced an ARM chipset for Android smartphones targeting $160 end user pricing. I’ve heard estimates that this chipset will sell in the “hundreds of millions”.
The question is: are these units going to be “activated” as per Google’s definition of Android?
Historically, MediaTek’s chips have been used in “grey market” devices. These are typically copies of branded phones and are sometimes shipped without IMEI numbers and hence not even sanctioned by regulatory authorities. If hundreds of million of such Android devices are sold in the next few years then tracking Android will become even more difficult.
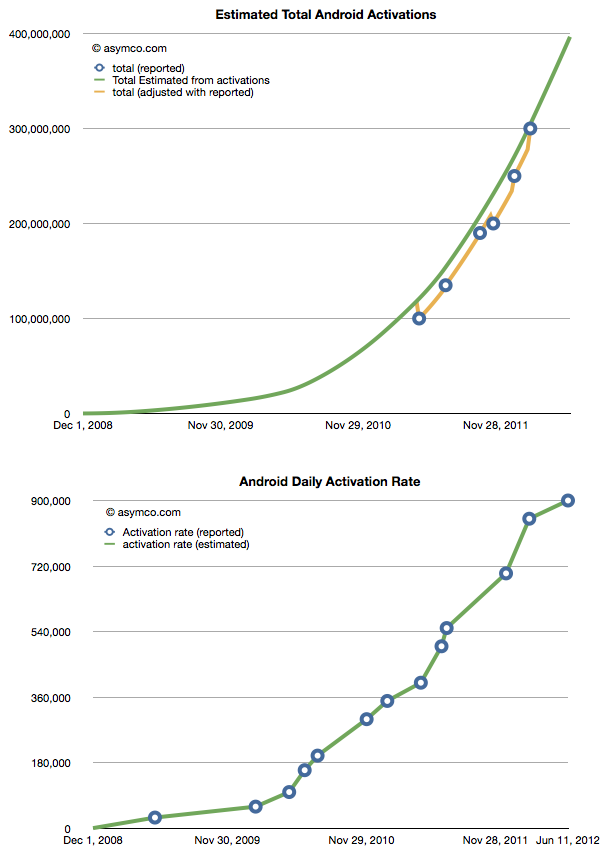
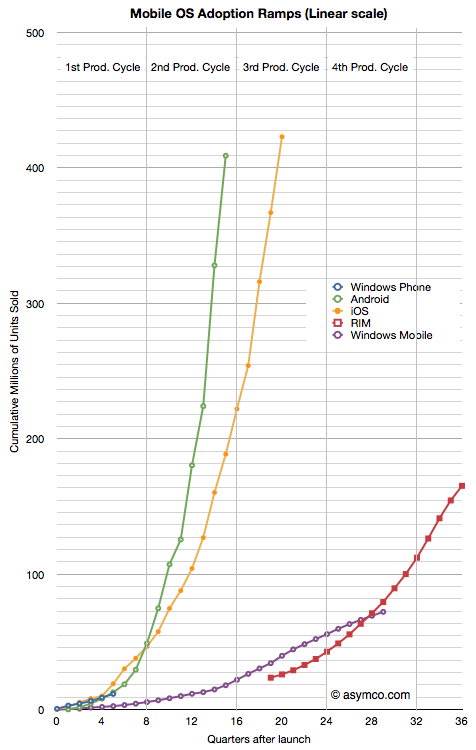
The current total is difficult enough. We just received an update on the activation rate (900,000 per day) and that allows us to create a picture of total cumulative activations.

We still don’t know the retirement rate so these are not devices in use, however most of these devices have been sold in the last two years implying they are (nominally) still functional. The following chart shows the ramp overlaid with an estimated 24 month product life cycle.

The one million per day Android activation rate has probably already been crossed with all the unsanctioned versions of Android available today. What will be the rate once the MediaTek chipsets are in wide distribution?

Chromebook Struggles To Make its Mark

Chromebook Struggles To Make its Mark:
With the release of Google’s next-generation Chromebook, the Samsung Series 5 550, the company is all set to provide its users with a whole new personal computing experience. Google’s OS focuses on saving a major amount of data within the cloud, running web applications from there, while saving little data to local storage. With this innovation-driven product, Google’s goal is to fundamentally change how we think about laptop computing.
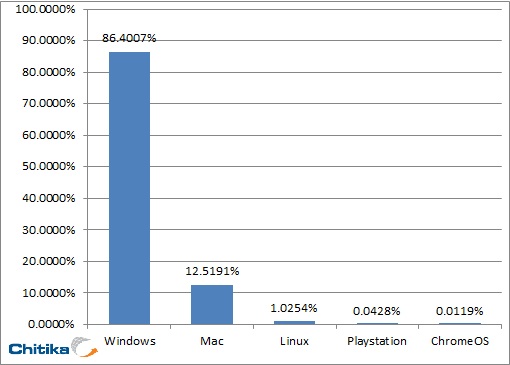
But the numbers tell an altogether different story. It’s been almost a year since the Chromebook was launched, but the actual Web usage market share of Chrome OS still seems to be extraordinarily low. Chitika Insights conducted a study, ranging from June 7 to June 13, 2012, on the Internet usage share of Chrome OS, comparing it with that of other operating systems. User agent analysis was used to aggregate hundreds of millions of impressions across various operating systems and achieve the following graphical results:
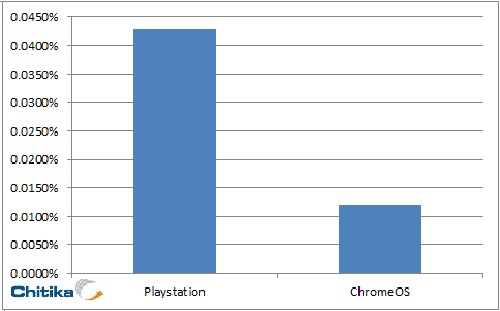
It shows a mere .0119% usage share for Chrome OS, quite unimpressive for a year-old, Internet-centric product. Even a gaming console like PlayStation has a usage share of .042% which is approximately 4 times that of Chrome OS. These figures clearly depict that Google has a long way to go as far as the operating system market is concerned, and with its present pace, competing with giants like Microsoft and Apple will be a daunting task for the company.
With Chromebook being more Internet dependent, its scope seems to be limited to the users who completely rely on the Web, rather than local projects. Despite increased usage, personal computing has not reached dimensions such that it can be called ‘completely Internet based.’ Today’s users do not want their computers to be largely just an expensive paperweight when they are offline. Therefore, a highly specific and targeted customer segment may be one of the prime reasons for Chrome OS’ low market share. Moreover, this data is an obvious hint to online advertisers and publishers regarding which direction to focus their marketing campaigns.

[Infographic] Beyond Siri: the next frontier in User Interfaces

[Infographic] Beyond Siri: the next frontier in User Interfaces:
This infographic presents major findings from our latest report – Beyond Siri: the next frontier in User Interfaces is a critical analysis of the virtual assistants market.
Helped by Apple’s successful launch of its Siri technology in 2011, voice-activated mobile virtual assistants (VAs) have crossed the chasm into mass-market deployments. Apple’s product triggered a wave of both imitation and innovation in the last year, including tens of smartphone applications. This was only for starters. Developers, speech recognition and AI vendors, telcos and handset manufacturers are now all working on bringing the next-generation VA to life
Beyond Siri breaks down the virtual assistant market and showcases key players, Android vs. iOS downloads and revenues, as well as the evolution of VA technology from the phone assistant to the lifestyle buddy. This is still a market of high volumes of downloads, but low revenues. While Google’s Voice Search leads in terms of downloads, claiming a huge 86% of the market, it’s actually Voice Actions by Pannous who’s snatching most of the revenues – $655 USD in 2011. Android gets the lion’s share in terms of downloads, since 94% of all Virtual Assistant apps are downloaded on Android devices. However, it’s iOS that makes developers money – despite the fact that iOS only has 6% of VA apps downloads, it accounts for 86% of revenues!
Full report on Virtual Assistant market available at www.visionmobile.com/VA
Feel free to copy the infographic and embed it in your website (embed codes below the infographic).
Beyond Siri: the next frontier in User Interfaces

[Report] Mobile Megatrends 2012

[Report] Mobile Megatrends 2012:
[Welcome to the new edition of our annual Mobile Megatrends report series. Megatrends 2012 analyses and interprets the nine most important trends of 2012, explaining how the software world is impacting the mobile business.]
Mobile Megatrends 2012
View more presentations from VisionMobile

The new Mobile Megatrends report

Mobile Megatrends 2012 is a 96-page research report – available for free download from our website or SlideShare – dissecting nine key themes:
- Handset DELL-ification and the emerging pyramid of handset OEM

- Web as the new walled garden and why the web is going back to the AOL days.

- Cross-platform tools as the next challenge to the Apple/Google duopoly

- The Kindelization of tablets – how Kindle is setting the rules of the tablet market

- Ecosystems battle across 4 screens and how experience roaming drives user lock-in, cross-sales and engagement

- Accessories as the next frontier for platform differentiation

- Tools for gold seekers and how the developer gold-rush has led to a gold rush for developer tools

- Reinventing the telco and how unbundling the telco is needed to compete in the software era

- The future of voice, from telephony to diversity of use cases
We’ll dig into two of these trends in this article – Handset DELL-ificationn and Cross-platform tools. To read the full analysis of all the trends, download the full report – feedback welcome.

The DELL-ification of the handset market

In late 2010, it was reported that Symbian had been toppled from the smartphone throne by Android. Back then, the difference in market share between Symbian and Android was just 2%. During 2011, the gap grew much larger, with Android claiming more than half of the shipments in the smartphone market, and Symbian dropping to single digits of market share. Android’s dominance in 2011 can be summarized in just one phrase: One in two smartphones shipped in 2011 was an Android handset.
The driver to Android’s success was the eagerness of many handset manufacturers to build cheap smartphones that can compete against the iPhone. Google, too, used Android to commoditize the smartphone market, indirectly reducing handset price points well below $100 and causing a loss of OEM differentiation, thus homogenizing smartphones into a single form factor.
While many handset rode the Android train into the smartphone market, it’s actually very few that are making real profits. Aside from Apple, Samsung is the only company of the Android court that’s achieving profitability. Together, Apple and Samsung accounted for 99% of all handset profits in Q1 2012. That means that 10s of Android handset makers will have to fight over the crumbs of the smartphone pie, i.e. the remaining 1% of the market profits.

The success of Apple and Samsung rests on their ability to add value across the entire value chain, from silicon to the cloud. Apple owns the iOS platform, hardware IP, handset design, content delivery and services, all the way to retail, combining these into a unique product experience.
Samsung also derives its competitive advantage from exerting control over the entire value chain, producing the components with the highest cost, notably screens and application chipsets. This allows the company to capture profits across the value chain, while its competitors can only capture the value of assembly. Ownership of the key components within the value chain allows Samsung to reap not only profit benefits, but also availability and time-to-market benefits. Samsung also leads Android makers by being the first to market with new Android releases and next-gen screens, which allows it to capture even more profits arising from early adopter sales.
Does all this mean that the smartphone market is entirely dominated by Samsung and Apple? While this might be true for the time being, there’s still room for new types of players, like Amazon, who could enter the smartphone market with a unique business model of subsidizing (self-branded) phones to drive a content and retailing ecosystem. Nokia continues to innovate in low-end handsets, notably with the release of the 110 phone running on S40 platform, and featuring a 1.8’’ screen at only 38 EUR before taxes and subsidy. To read more on the opportunities of the smartphone market, download the full report.

Cross-Platform Tools and the challenge to the Apple/Google duopoly

In order to maximize their reach, developers need to have apps running across multiple platforms. The challenge with that is that developers have to learn a variety of different programming languages, vastly different to each other, as well as use various app stores. The situation is especially difficult for developers who are just entering mobile – and there are millions of those!
Cross-platform tools are a solution to increasing reach without accruing costs, by simplifying the porting of an app across different platforms. There’s a plethora of different tools available (see our comprehensive Cross-Platform Tools 2012 report for the full list), which cover diverse technologies and solutions, from source code translators to hybrid web tools. Impeded by teething issues, the CPT market has not come into full swing yet, but it’s quickly gaining acceptance with leading tools like PhoneGap and Sencha that have made it into the mainstream.
What CPTs bring to the table is the democratization of development, by extending the reach of masses of web developers beyond the browser. Despite performance disadvantages and fragmentation across different browser versions, HTML5 has emerged as the most widely supported authoring technology for cross-platform apps. Cross-platform tools are taking HTML further than web browsers can, by allowing web developers to create native smartphone apps, using for example PhoneGap. CPTs are accomplishing this by unifying the authoring side- rather than the runtime side – of the app across platforms.
In addition, cross-platform tools are threatening the Apple/Google duopoly. 2012 marks an inflexion point in the war of mobile ecosystems where the network effects built by Apple and Google are being challenged by an unsuspected new entrant – CPTs make it easier, for example, for an iPhone developer to reach Android and Windows Phone 7 users. CPTs dilute network effects by allowing other ecosystems to compete not just in terms of the number of apps listed, but also the availability of top apps, the time-to- market (an app rarely appears at the same time across all platform app stores) and the overall app quality.
We expect web developers to be at least ten times as many as native mobile developers, which means that the still-nascent CPT market will quickly grow in the near future. Although not necessarily a replacement for native development, cross-platform tools will become more prominent, easing the way for 100s of thousands of developers who are just entering the mobile market.
Read more on the growth of the CPT space and the top vendors in the full report.

The Megatrends report series

Now in its 5th edition, our annual Mobile Megatrends report identifies the major trends in mobile – from the accessories market to the Kindel-ization of tablets and the battle of ecosystems across 4 screens.
The full report is available as a free download. You can also view the whole report on SlideShare (see embedded window at top of article)

If you’re interested in a 1-day on-site strategy workshop – with more in-depth insights into these trends, contact matos@visionmobile.com
Feedback welcome, as always
- Matos

@visionmobile